Third Country, Same Result

timellison.substack.com
Undeniable Confirmation of the High (Positive) Correlation between the mRNA Injection Rate and the Mortality Rate
Third Country, Same Result
TIM ELLISON
MAY 17, 2023
In previous posts I showed that most of the Variations in a country’s All-Cause-Mortality-Rate can be accounted for by Variations in the mRNA Injection
1
Rate. This was previously shown for:
Today I did this analysis for Canada using using DATA
2
for
All-Cause-Mortality and
Injections provided on the Internet from the Canadian Government
3
Description of Analysis Technique
The Correlation between the weekly All-Cause-Mortality and Injection rates was calculated over a 16 week period. The Mortality rate was then delayed by 1, 2, … 16 weeks and the Correlation again calculated for each delay.
The above calculation was then repeated 8 more times beginning each subsequent calculation 4 weeks later in time using DATA spanning the range from 10/9/21 to 12/31/22.
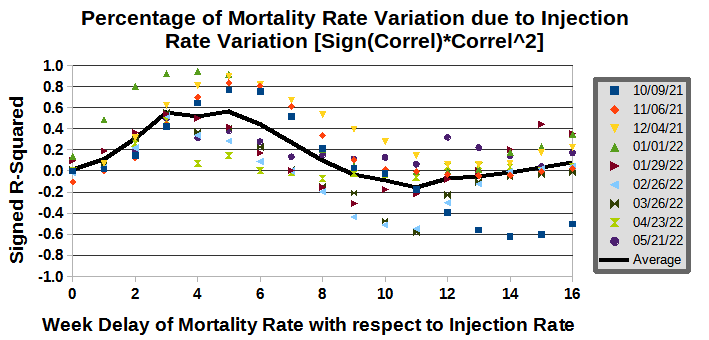
This analysis is summarized below in Figure 1.
 Fig. 1.
 The “signed” R-Square Value for Mortality and Injection Rates in Canada as a function of the delay in the Mortality Rate with respect to the Injection Rate. At least 60% of the variation in the Canadian Mortality Rate is due to variations in the Injection Rate. See footnote
4
below for discussion of Correlation and R-Squared.
Discussion
- Consistent with previous findings, the peak in death due to injections is in the first 8 weeks after injection.
- This analysis will not show deaths occurring after a long time period which also probably have large variations in the time between injection and death.
- If (BIG IF, I hope) there is ever again a large scale worldwide injection program, the rate of injection should be mandated to be modulated at about 3 different frequencies to be able to easily detect the positive (or negative) effects of the injections using synchronous detections techniques that I have used here using random variations
5
- I’m uncertain of the quality of these data — noise and inaccuracies in these data probably obscure the findings, as stark as they are.
- These are the best DATA available (100’s of millions of people and billions of injections) and the findings are robust. I have estimated that these injections have killed at least 1 Million American and 20 Million others around the world.
PLEASE, share this work widely.
These injections are now part of the CDC recommendations for our children aged 6 months and older.
1
I am careful to discriminate between “numbers” (from models or just made up) and DATA (numbers coming from measurements). For example, about the only “numbers” from the CDC that I think are DATA are the counting of death certificates (All-Cause-Mortality [
https://gis.cdc.gov/grasp/fluview/mortality.html]) and number of mRNA-Doses given [
https://covid.cdc.gov/covid-data-tracker/#vaccination-trends]. A few people make a lot money from these injections, so I conjecture that these numbers might be reasonably-well tracked.
2
I refuse to call the mRNA-injections a “vaccine”,
since it has been shown by the Cleveland Clinic that the more one is injected, the higher is one’s chance of getting CoVid. But of course, that was meaningless result: who cares whether you contract a disease with a >99.9% survival rate? The question the Cleveland Clinic should have asked is, “What is the All-Cause-Mortality-Rate as a function of the number of Injections?”. That is the only metric one should look at (e.g., Vioxx).
The U.K. ONS data show that the mortality rate of those injected is about a factor of 2 higher than those not injected, regardless of age. I conjecture we would see a similar result in the U.S. if these data were made available.
3
Wonder how much longer these DATA will be there …
4
The R-Squared Value (the Correlation Value squared) denotes the percentage of the dependent variable (Mortality) caused by the independent variable (Injection). The R-Squared value, however, is always positive, whereas the Correlation also tells whether it is a positive or negative correlation. I consequently plot the (Sign of the Correlation Value) times the (R-Squared [Correlation Squared]) value. The absolute value of the Correlation Value is always higher than that of the R-Squared value.
5
Maybe I shouldn’t have said this … beware of any mass injection program in the future, ESPECIALLY if the injection rate is very constant over time (e.g., “the injections you are all clamoring for are limited …”. This will be noted, I’m sure.


 citizenfreepress.com